
Fig. 2.
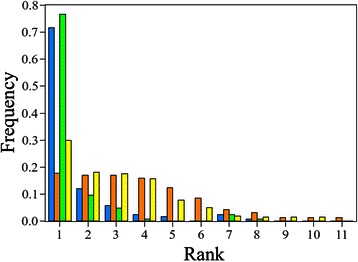
Performance of TMFoldRec. The performance of TMFoldRec algorithm was tested on 124 TMPs (2 < NTM ≤ 16). Blue bars denote the frequency of native folds ranked by TMFoldRec. Orange bars are the results of random prediction. Green bars denote the performance of TMFoldRec with topology filtering. The yellow bars are the corresponding random predictions.