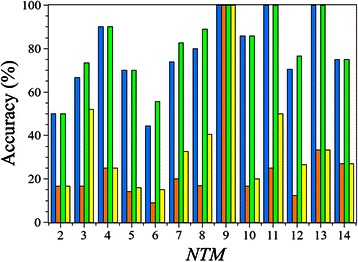
Fig. 3.

Performance of TMFoldRec in the function of NTM. Blue and green bars denote the topology filtered and non-filtered accuracy of TMFoldRec, respectively. The orange and yellow bars are the corresponding random predictions, which imply the number of different folds.
