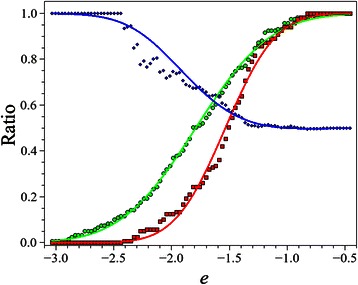
Fig. 4.

Performance of reliability prediction. Green and red dots denote the normalized cumulative histogram of reduced energy (e) values of native and decoy structures, respectively. The continuous green and red lines are the fitted curves. The blue dots are the calculated ratio of the native folds below the given reduced energy value. The blue line is the theoretical curve.
