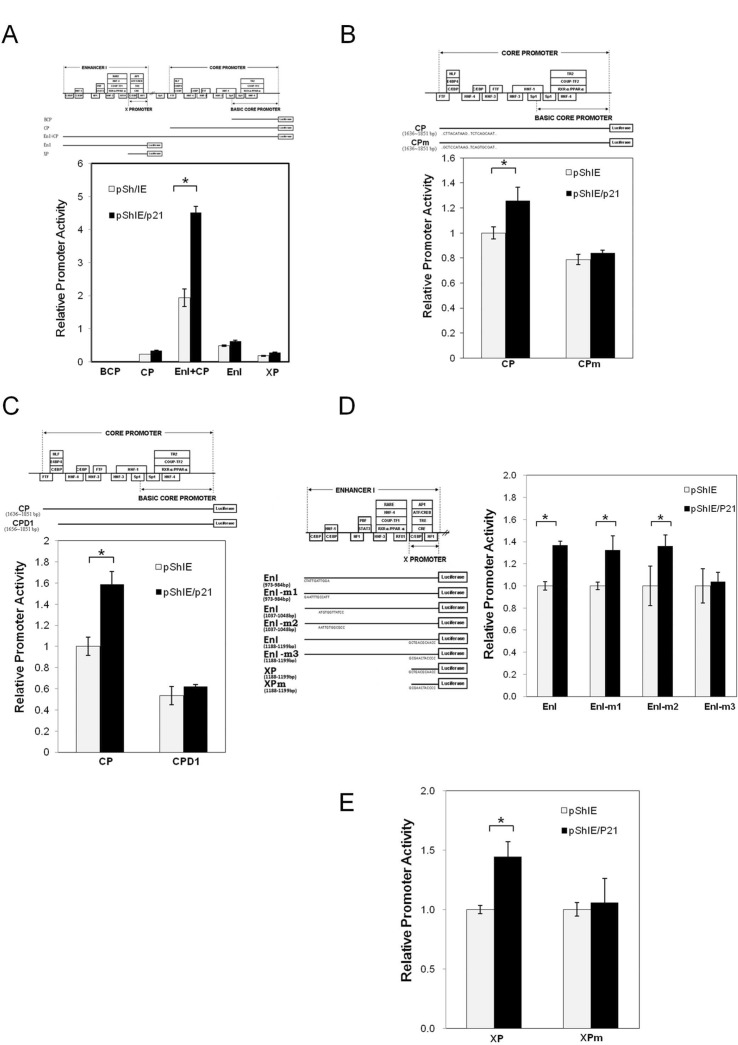
Fig 3. Identification of p21 responsive elements within the HBV genome.
HepG2 cells were co-transfected with pShIE/p21 or mock control (pShIE) together with an appropriate indicated luciferase reporter plasmid. These were (A) luciferase reporter plasmids driven by the various HBV promoters, namely the BCP (basic core promoter), the CP (core promoter), EnI+CP (enhancer I plus the core promoter), EnI (enhancer I) and XP (the X promoter), (B) luciferase reporter plasmid driven by the HBV core promoter (CP) and the HBV core promoter with a deletion (CPD1), or the HBV core promoter with a mutation at two C/EBP binding sites (CPm), (D) luciferase reporter plasmid driven by the HBV EnI and EnI with mutations at three different C/EBP binding sites (EnI-m1, EnI-m2 and EnI-m3). (E) luciferase reporter plasmid driven by the HBV X promoter and HBV X promoter with a mutation at the C/EBP binding sites (XPm). Cells were co-transfected with pSV40-beta-galactosidase plasmid in order that the galactosidase activity of each sample could be used for normalization. After transfection for 3 days, the cell lysates were extracted to examine the luciferase and galactosidase activity levels of the samples. The schematic shows the relative location of the promoter sequences used in the various assays. The relative luciferase activity of the different promoters using cells with or without p21 overexpression are shown in the bar chart. The grey bar represents the cells without p21 overexpression, and the black bar represents the cells with p21 overexpression. The results are shown as the relative firefly luciferase activity levels normalized against each sample's beta-galactosidase activity; the experiments were carried out in triplicate. The relative ratios of the luciferase activity of the cells with or without p21 overexpression are also shown below the chart. *, p < 0.01, 2-sided unpaired t test.

