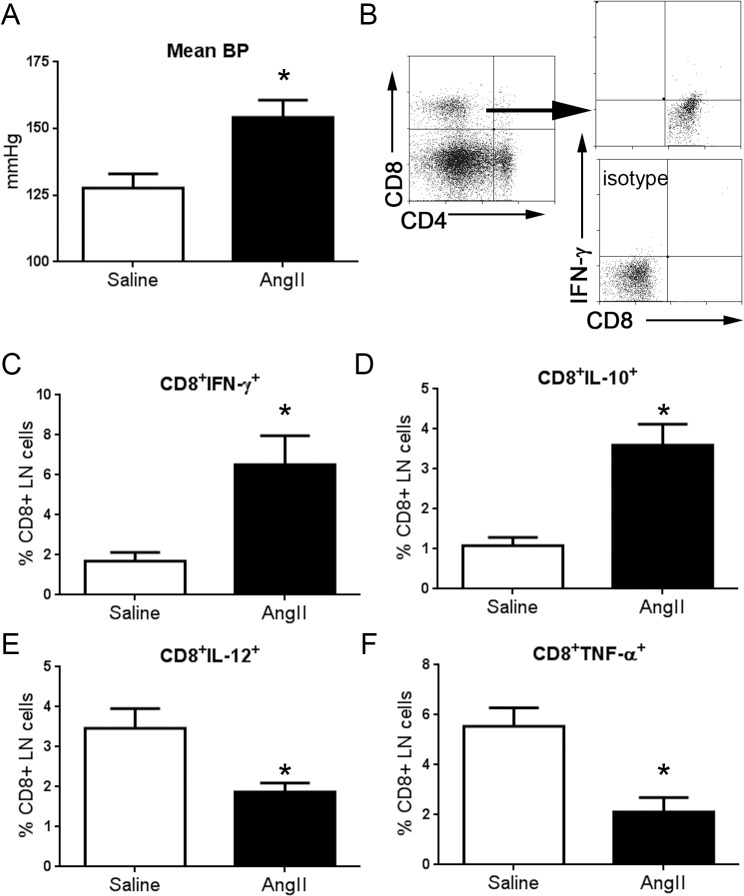
Fig 1. The effect of AngII infusion on blood pressure and CD8+ T cell immune cytokine profile.
(A) Mean blood pressure was significantly increased in mice infused with AngII (N = 10) compared to mice infused with saline (N = 8; *P<0.05). (B) Representative scatter plot of gating strategy used for analysis of LN CD8+ T cells in mice infused with saline or AngII. The percentage of CD8+ T cells that were stained with IFN-γ (C), IL-10 (D), IL-12 (E), or TNF-α (F) were plotted on a bar graph. Saline N = 4; AngII N = 5; *P<0.05.

