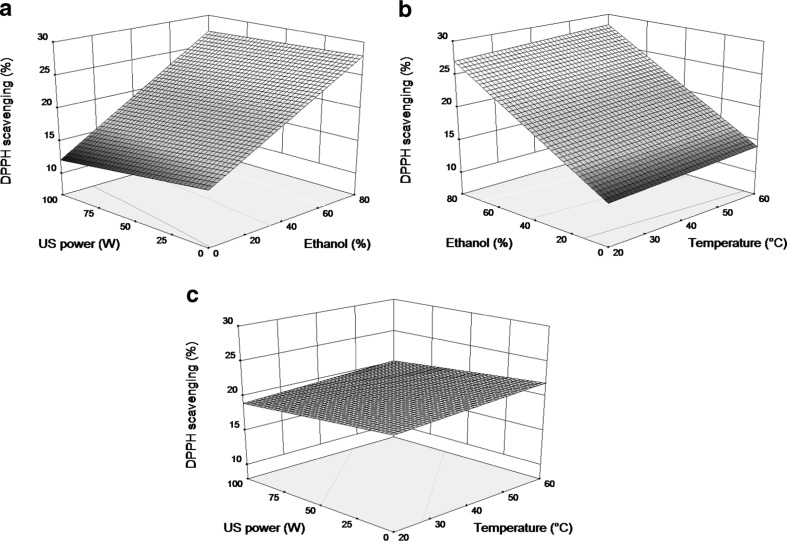
Fig. 5.
Response surface plots of quinoa seed extracts a showing interaction between extraction temperature and ethanol concentration, b showing interaction between ethanol concentration and ultrasound power, c showing interaction between extraction temperature and ultrasound power on antioxidant activity. The value of the missing variable in each plot was kept at the center point

