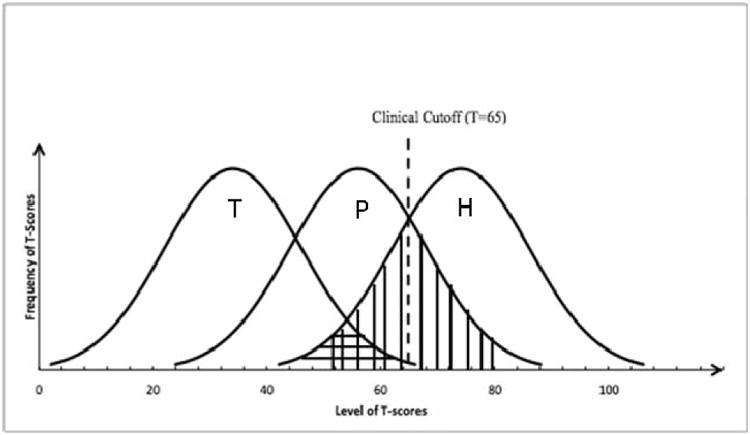
Figure 3.

Graphical depiction of T-score distributions of teacher reports (left, labeled “T”), parent reports (center, labeled “P”), and independent home-based assessments of disruptive behavior (right, labeled “H”), in a hypothetical sample of young children.
