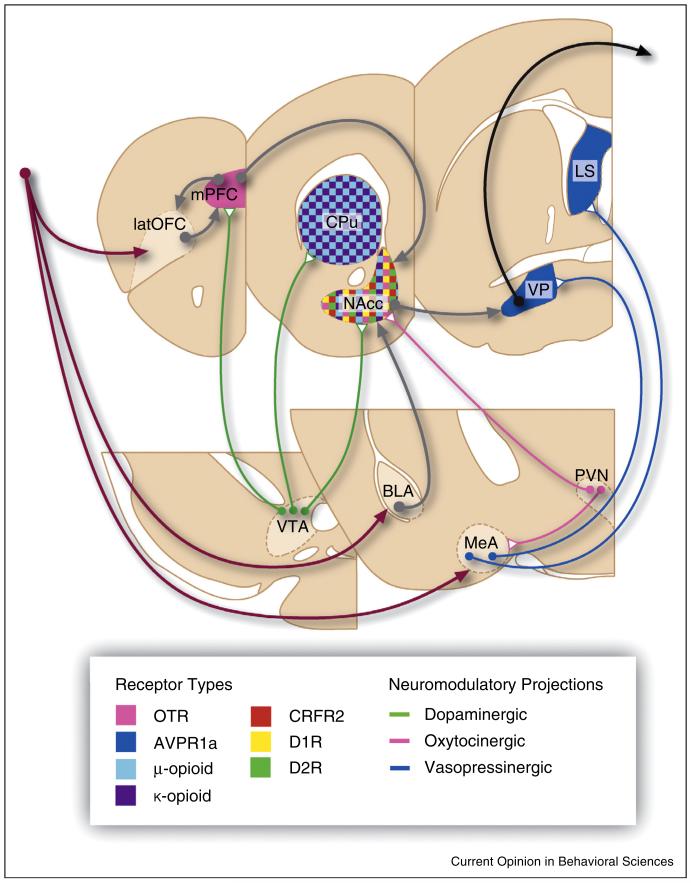
Figure 1.
Neurobiological systems mediating pair bonding behavior. This schematic illustrates a neural network model of pair bond formation and maintenance based on studies in prairie voles. The model highlights key axonal projections, neuromodulators, and receptor populations involved in pair bonding. Maroon arrows illustrate key points of entry for incoming sociosensory cues. Gray arrows represent axonal projections transmitting social information across brain areas during bonding. The black arrow represents axonal projections to downstream motor nuclei leading to behavior. As indicated in the figure legend, colored projections with closed white triangles indicate neuromodulatory projections (dopamine-green; oxytocin-pink; vasopressin-blue) that modulate transmission and encoding of social information during bonding. Receptor populations that have been implicated in either formation or maintenance of pair bonds in prairie voles are indicated by solid colors within brain areas. Important neural loci are indicated with abbreviated labels (BLA, basolateral amygdala; CPu, caudate putamen; latOFC, lateral orbitofrontal cortex; LS, lateral septum; MeA, medial amygdala; mPFC, medial prefrontal cortex; NAcc, nucleus accumbens; PVN, paraventricular nucleus of the hypothalamus; VP, ventral pallidum; VTA, ventral tegmental area).

