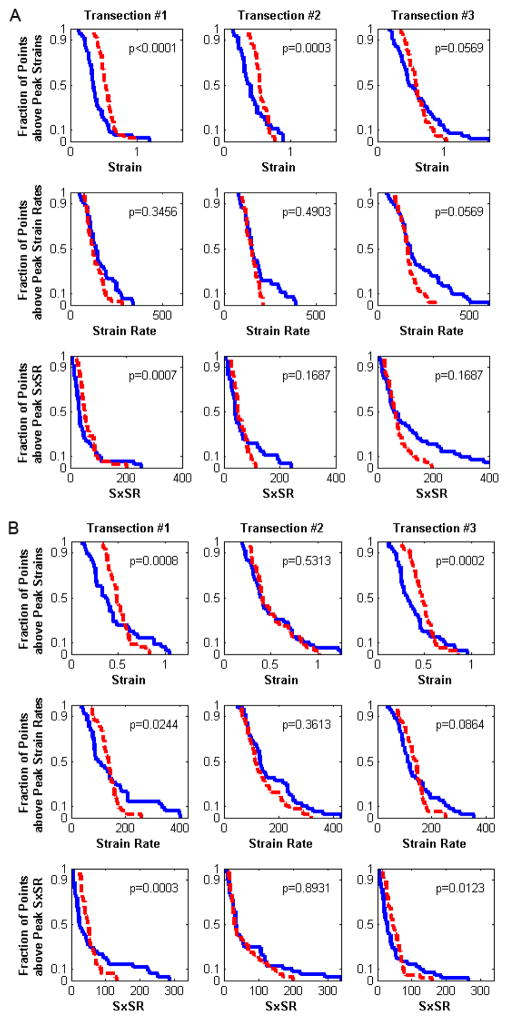
Figure 9.
(A) 5-day-old and (B) 4-week-old experimentally-derived (blue solid lines) and FEM-predicted (red dashed lines) cumulative distributions for the lowest optimized modulus values (553Pa and 692Pa, respectively). A KS test p-value for each distribution comparison of greater than 0.05 indicates that the two populations are a good-fit.

