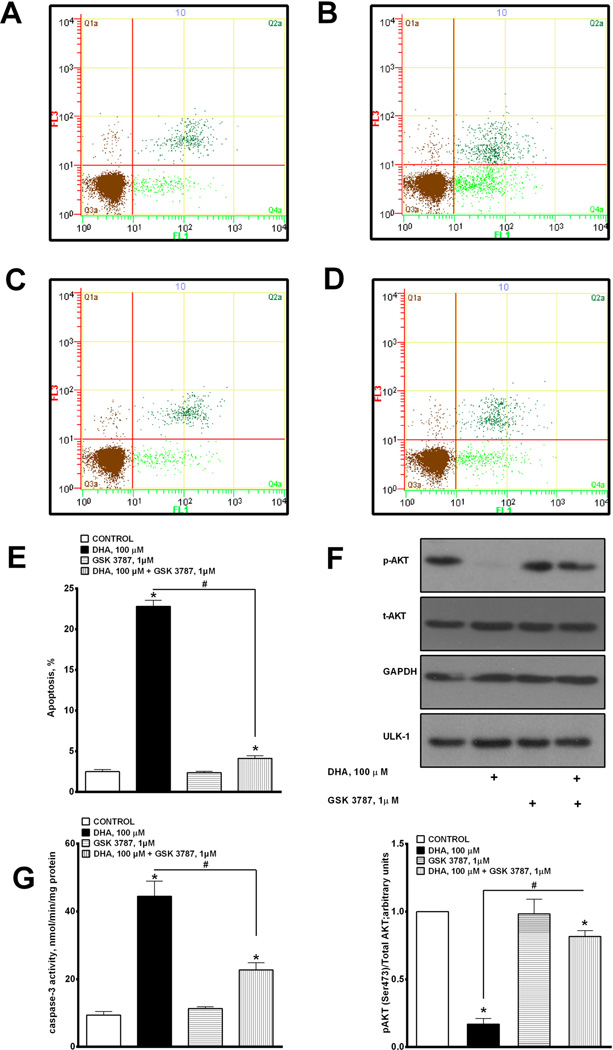
Fig. 3.
DHA-induced apoptosis mediated via PPARδ-signaling. (A–D) Representative bivariate dot plots of Annexin-V FITC and propidium iodide binding. Apoptotic cells were assessed by combining values falling in the upper and lower right quadrants. (E) Histogram summarizing flow cytometry data demonstrating induction of DHA-induced apoptosis. (F) Cells were harvested and subjected to western blotting to assay the level of p-AKT (upper insert), and quantified (lower insert). (G) Caspase-3 activity was 19,20-EDP with or without GSK 3787 1 µM and assessed at 24 h. (C) Cell viability and (D) cellular metabolic activity were measured. (E) PPARδ DNA binding was quantified using an ELISA kit. Values are expressed as mean ± SEM; N = 3; *p < 0.05 EDPs or 19,20-EDP 1 µM vs. control, #p < 0.05 19,20-EDP 1 µM vs. 19,20-EDP 1 µM and GSK 3787 1 µM. (F) LC/MS analysis was employed to measure the accumulation of ceramide following treatment with 0 or 100 µM of DHA with or without MS-PPOH 50 µM, EDPs mix 1 µM (1:1:1:1:1; 7,8-, 10,11-, 13,14-, 16,17- and 19,20-EDP) or 1 µM 19,20-EDP with or without GSK 3787 1 µM and assessed at 24 h. Values are expressed as mean ± SEM; N = 3; *p < 0.05 EDP 1 µM vs. control, #p < 0.05 EDPs 1 µM vs. EDPs 1 µM and GSK 3787 1 µM, #p < 0.05 19,20-EDP 1 µM vs. 19,20-EDP 1 µM and GSK 3787 1 µM.

