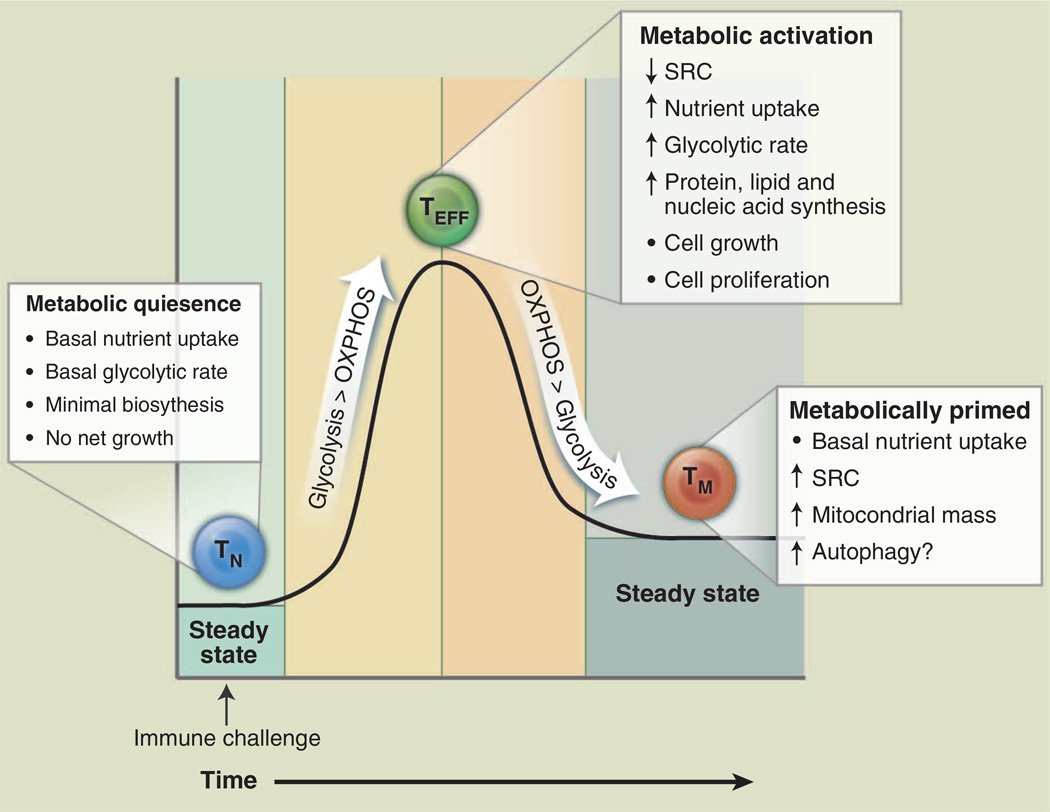
Fig. 1. T cell metabolism changes over the course of an immune response.
T cells display distinct metabolic profiles depending on their state of activation. Naïve T cells (TN, blue) are metabolically quiescent; they adopt a basal level of nutrient uptake and use OXPHOS as their primary pathway of ATP production. Upon immune challenge, TEFF (green) cells shift to a state of metabolic activation characterized by increased nutrient uptake, elevated glycolytic and glutaminolytic metabolism, biomass accumulation, and reduced mitochondrial SRC. TEFF cells preferentially use glycolysis over OXPHOS for ATP production. Transition to the TM (orange) stage is characterized by a quiescent metabolism, with increased reliance on FAO to fuel OXPHOS. Mitochondrial mass and SRC are elevated in TM cells, suggesting that these cells are metabolically primed to respond upon reinfection.

