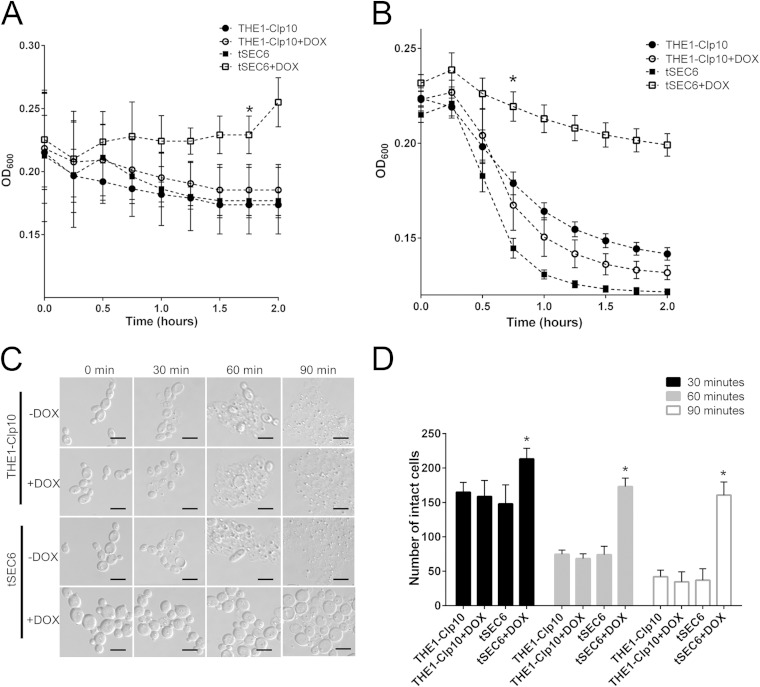
FIG 5.
Qualitative determination of cell wall components via enzymatic assays. (A) Strains were incubated for 24 h with or without DOX, in the presence of chitinase. Chitinase activity was followed spectrophotometrically at a wavelength of 600 nm, at which a decrease in optical density occurs as cell wall material is degraded. Optical density readings were significantly higher for the tSEC6 mutant in the presence of DOX compared to the controls after 2 h of incubation with chitinase, indicating resistance to cell lysis. The asterisk indicates a statistically significant difference (P < 0.005) at the time point indicated and later time points. (B) Strains were incubated for 24 h with or without DOX, in the presence of Zymolyase 100T. Zymolyase activity was followed spectrophotometrically at a wavelength of 600 nm. Optical density readings were significantly higher for tSEC6 in the presence of DOX after 45 min of incubation with zymolyase, indicating resistance to cell lysis by zymolyase. The asterisk indicates statistically significant difference (P < 0.005) at the time point indicated and later time points. (C) Following incubation with zymolyase, formation of spheroplasts was visualized using light microscopy. Spheroplast formation and cell lysis were reduced in strain tSEC6 grown under restrictive conditions. Bar, 10 μm. (D) The number of cells that were unaffected by zymolyase was determined over time. Three independent experiments were performed in which the number of intact cells over 10 fields per slide per treatment were counted. There was a significant increase in the number of cells that were not affected by zymolyase in strain tSEC6 grown in the presence of DOX as early as at 30 min of incubation with zymolyase compared to the controls. The asterisk indicates a statistically significant difference between wild-type controls and tSEC6 grown with DOX (P < 0.005).

