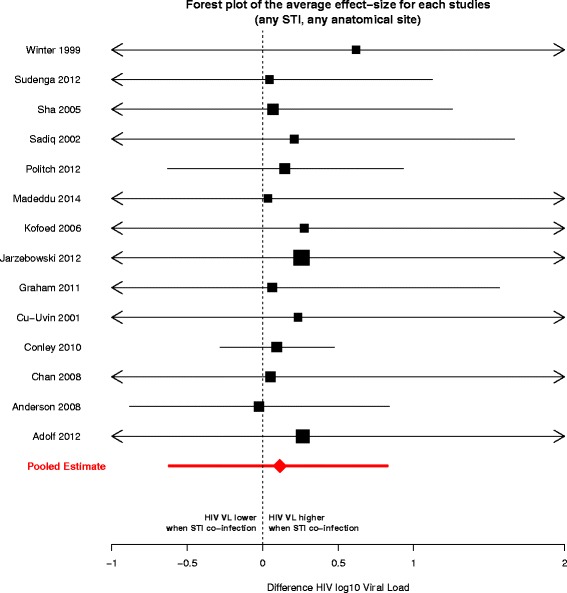
Fig. 2.

Posterior means and 95 % credible intervals of the effect size for each study included in the meta-analysis. The effect size is expressed as the difference of HIV viral load (log10) between an individual HIV positive, co-infected with any other STI and an individual only infected with HIV. The black square represents the posterior mean, with its area proportional to study sample size. The red diamond and arrows reflect estimates of the pooled effect (i.e., across all studies, STIs and anatomical sites)
