
Fig. 4.
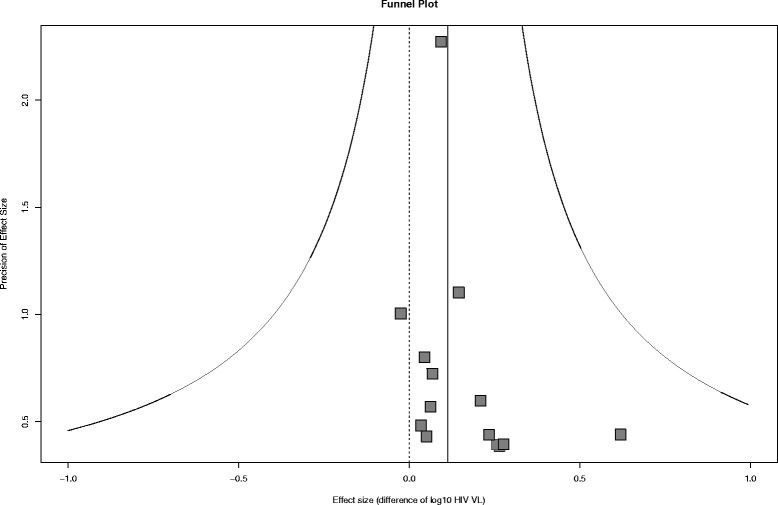
Funnel plot. The horizontal axis represents the mean posterior effect size for each study (the log10 HIV viral load between HIV positive individuals with and without STI co-infection), the vertical axis is the effect size precision (inverse of the standard deviation) of the associated study. Each point represents a study. The solid vertical line represents the mean effect size and the solid curved lines represent its 95 % CI. The dashed vertical line represents a null effect size (no HIV viral load difference)