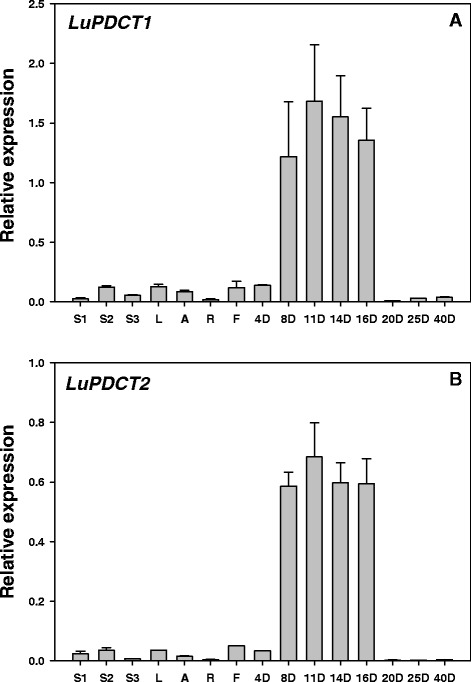
Figure 2.

Relative expression levels of LuPDCT1 (A) or LuPDCT2 (B) in flax vegetative tissues, flowers, and during embryo development. Transcript levels were compared across different tissues and at different stages of embryo development using the two reference genes, GAPDH and UBI2. Data shown represent means ± SE of three biological and three technical replicates. S1, immature stem; S2, developing stem; S3, mature stem; L, leaves; A, apexes; R, roots; F, flowers; 4 to 20D, days after anthesis of developing embryos; 25D and 40D, days after anthesis of mature seeds.
