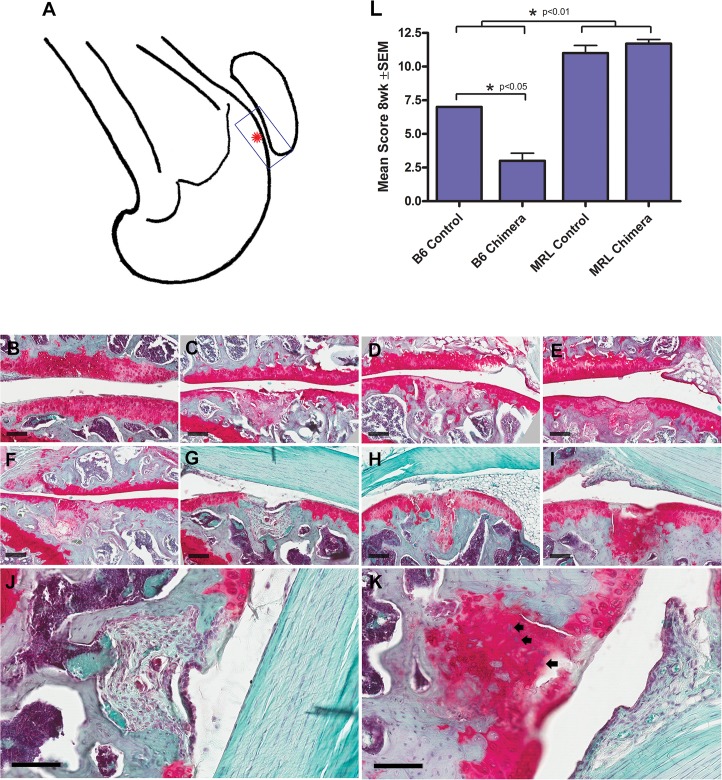
Fig 4. Cartilage defect healing in C57Bl/6 and MRL/MpJ mice.
A: Schematic of mouse femur showing location of the cartilage defect (asterisk) and the area of the joint enlarged in panels B-K. B-I show representative healing cartilage defects stained with haematoxylin, fast green and Safranin-O. Scale bars = 100μm. B: Uninjured cartilage. C, D, E: 4 week healing cartilage from B6 control, B6 chimera and MRL control mice respectively. F, G, H, I: 8 week healing cartilage defects from B6 control, B6 chimera, MRL control and MRL chimeric mice, respectively. J and K: High power images of 8 week cartilage defects from panels G (B6 chimera) and I (MRL chimera) respectively. Arrows in K indicate MRL cells surrounded by newly formed proteoglycan matrix that are not seen in B6 mice (J). Graph L shows the average histological scores for the 4 animal groups (asterisk indicates statistically significant difference in all MRL vs all B6 mice, p<0.01).

