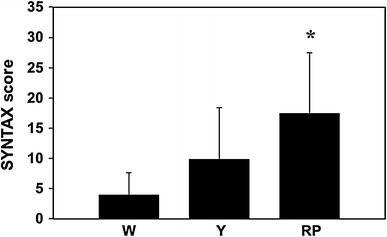
Fig. 3.

The extent and severity of coronary artery disease using SYNTAX score: A bar graph shows the SYNTAX score in the W-group (W), Y-group (Y), and RP-group (RP). SYNTAX score was significantly higher in the RP-group than in the W-group. *P < 0.05 versus W-group. Values represent mean ± SD
