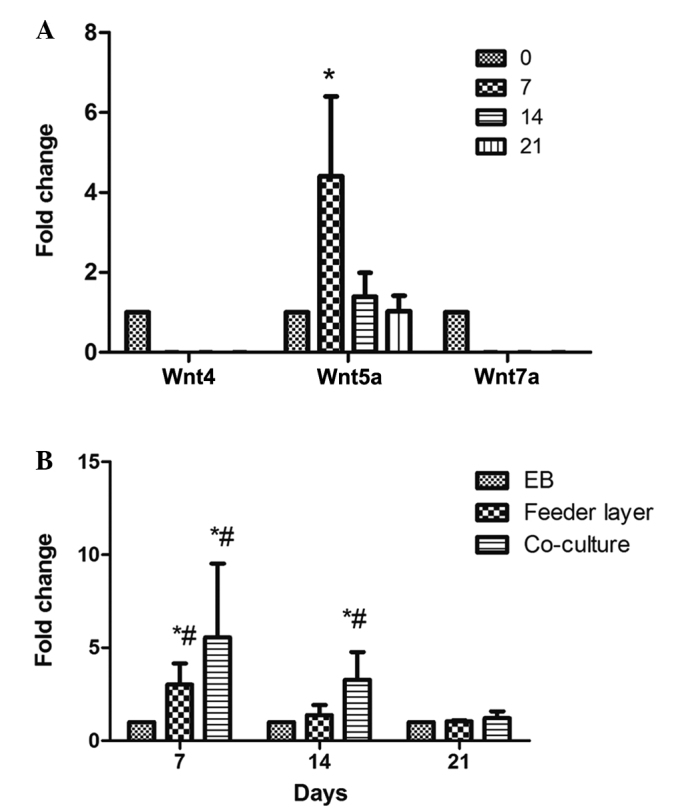
Figure 5.

Expression levels of Wnt4, Wnt5a and Wnt7a in the differentiated cells. (A) mRNA expression levels of Wnt4, Wnt5a and Wnt7a in the differentiated cells induced by EB on days 0, 7, 14 and 21. *P<0.05, vs. each of the other groups. (B) Effects of the three methods on the mRNA expression levels of Wnt5a in the differentiated cells. Total RNA from the differentiated cells was isolated on days 7, 14 and 21 and subjected to reverse transcription-quantitative polymerase chain reaction analysis. *P<0.05, vs. each of the other groups at the same time point; #P<0.05, vs. other time-points in the same group. Data are presented as the mean ± standard deviation (n=3). EB, embryoid body.
