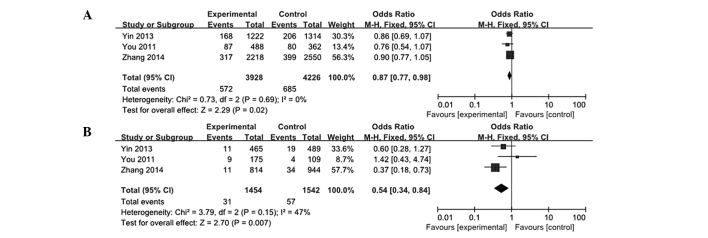
Figure 3.

Subgroup analysis of the association between pri-miR-124-1 rs531564 and esophageal squamous cell carcinoma risk. (A) G vs. C; (B) GG vs. CC. Odds ratio and 95% confidence interval (CI) were pooled. The area of the squares reflects the study specific weight (inverse of the variance). The diamond represents the pooled OR and 95% CI.
