
Figure 1.
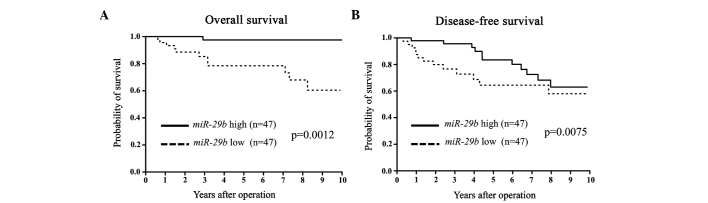
(A) Overall survival (OS) and (B) disease-free survival (DFS) curves for breast cancer patients according to the expression levels of microRNA-29b (miR-29b) in primary tumors. The differences in OS and DFS were significant (P=0.0012 and 0.0075, respectively).