
Figure 4.
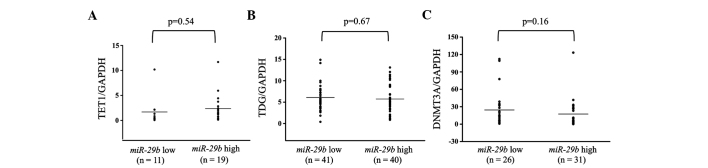
MicroRNA (miR) expression of (A) TET1, (B) TDG and (C) DNMT3A in miR-29b low- and high-expressing primary breast cancer tumors. The high miR-29b expression level was above and the low miR-29b expression level was below the mean expression value of all the samples (n=94). The horizontal line in the graph represents the mean of each group. There were no significant differences in any of the samples. GAPDH, glyceraldehyde-3-phosphate dehydrogenase.