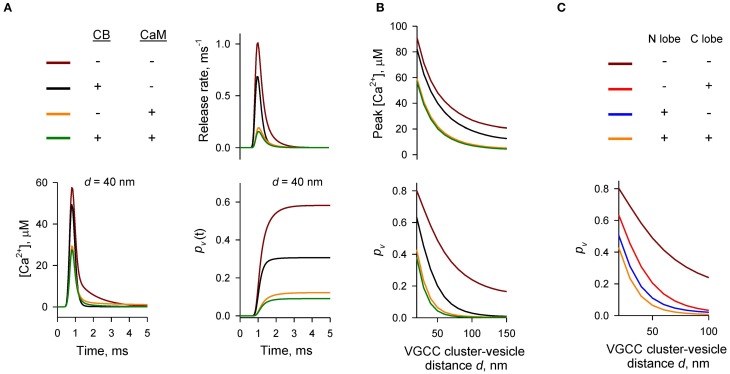
Figure 2.
Dominant effect of CaM on inhibition of AP-evoked vesicular release probability pv. (A,B) Simulation results for different presynaptic Ca2+ buffer mixtures, color codes are shown on the top left in (A). (A) Time courses for [Ca2+] (bottom left), vesicular release rate (top right), and cumulative vesicular release probability pv(t) (bottom right) for a representative VGCC—Ca2+ sensor coupling distance d = 40 nm. (B) Dependencies of peak [Ca2+] at release sensor (top) and pv (bottom) on distance d. (C) Relative contributions of the N- and C-lobes of CaM to inhibition of pv at different distances d. CB was absent in this set of simulations.

