Figure 3.
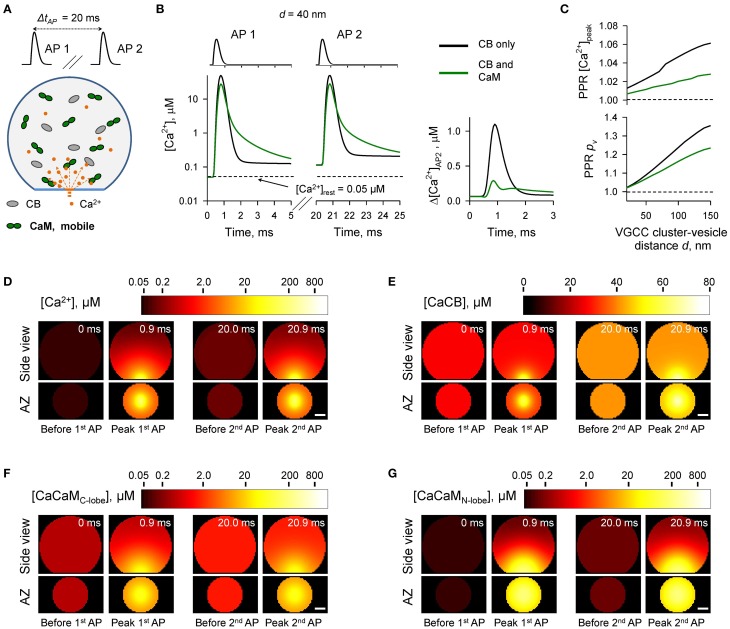
Effect of mobile CaM on short-term synaptic plasticity. (A) Schematic representation of the paired-pulse simulation experiment (ΔtAP = 20 ms) with mobile CaM, see text for details. (B) Comparison of [Ca2+] time courses at the vesicular release Ca2+ sensor for a representative coupling distance d = 40 nm during paired-pulse stimulation (AP 1 and AP 2) with and without mobile CaM in the presynaptic bouton. Left, [Ca2+] transients; right, net increase of [Ca2+] at the second AP (Δ[Ca2+]AP2 = [Ca2+]AP2 − [Ca2+]AP1). (C) Dependencies of PPR[Ca2+]peak = [Ca2+]AP2peak/[Ca2+]AP1peak and PPRpv = pvAP2/pvAP1 on the coupling distance d. pvAP1 and pvAP2 were determined as the horizontal asymptotes of pvAP1(t) and pvAP2(t) after the first and the second APs respectively. (D–G) Snapshots of spatial distribution of Ca2+ (D, [Ca2+]), Ca2+ bound to CB (E, [CaCB] = [CaCBfast] + [CaCBslow]), and Ca2+ bound to the C-lobe (F, [CaCaMC-lobe] = [CaCTCR] + 2 · [CaCRCaCR]) and the N-lobe (G, [CaCaMN-lobe] = [CaNTNR] + 2 · [CaNRCaNR]) of CaM during paired-pulse stimulation. Side view, XZ plane through the center of the bouton (as in A); AZ, 10 nm thick plane immediately above the AZ. Scale bar 100 nm.

