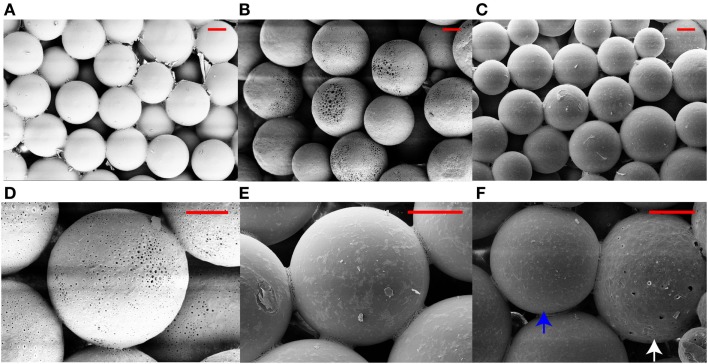
Figure 1.
Scanning electron micrographs of acellular microsphere-based scaffolds. The images reveal the distinct morphological features of the microspheres in different scaffold groups: (A) PLGA, (B,D) CS, (C,E) TCP, and (F) GRADIENT at the CS (white arrow)-TCP (blue arrow) transition region. Scale bar: 100 μm.

