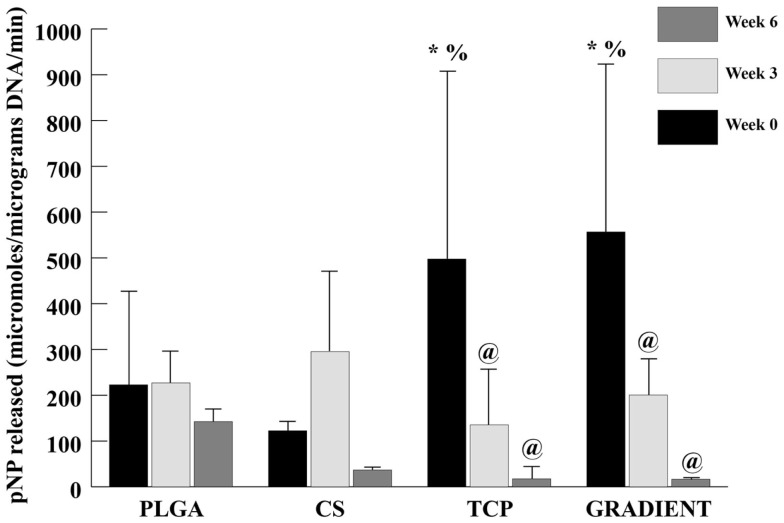
Figure 8.
ALP activity in micromolar pNP released per micrograms DNA per minute. All values are expressed as the average ± SD (n = 3–5), p < 0.05. @Statistically significant change over week 0 value, *statistically significant change over the PLGA group at same time point, and %statistically significant change over the CS group at same time point.

