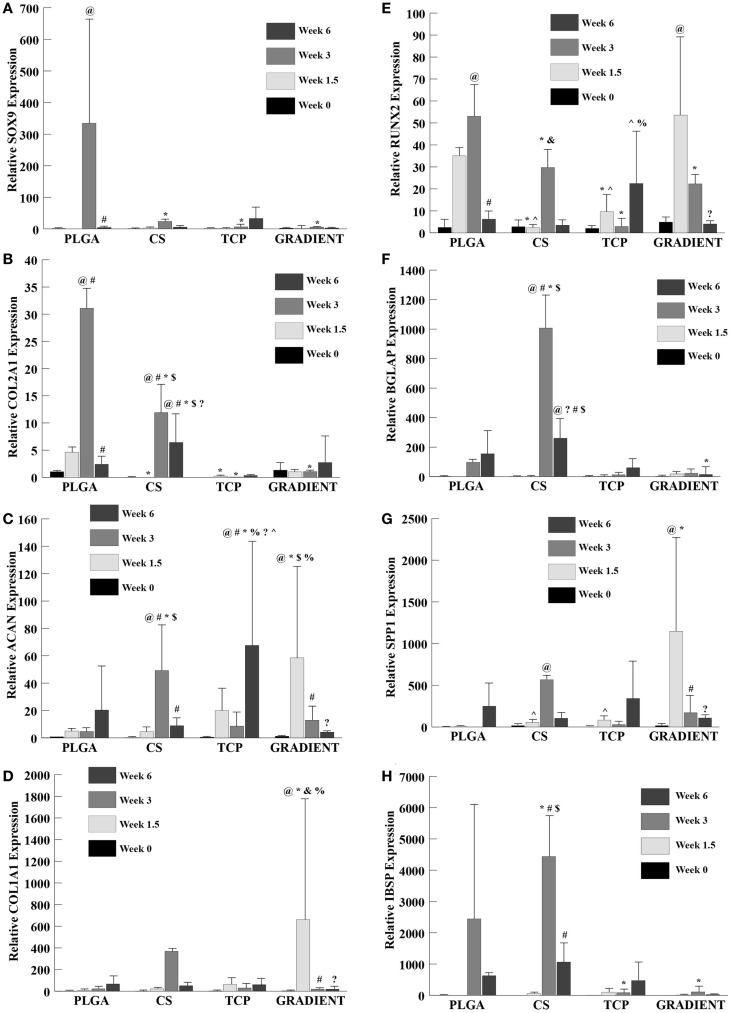
Figure 9.
Relative gene expression. All values are expressed as the average ± SD (n = 3–5). (A) SOX9 expression: the PLGA group at week 1.5 is not reported because of insufficient sample size (n < 3). (B) COL2A1 expression: the TCP group at week 0 is not reported because of insufficient sample size (n < 3). (C) ACAN expression. (D) COL1A1 expression. (E) RUNX2 expression. (F) BGLAP expression: the PLGA value at week 1.5 is not reported because of insufficient sample size (n < 3). (G) SPP1 expression. (H) IBSP expression: the PLGA group at week 1.5 is not reported because of insufficient sample size (n < 3), p < 0.05. @Statistically significant change over week 0 value, #statistically significant change over its value at previous time point, *statistically significant change over the PLGA group at same time point, $statistically significant change over the TCP and GRADIENT groups at same time point, ?statistically significant change over week 1.5 value, %statistically significant change over the CS group at same time point, &statistically significant change over the TCP group at same time point, and ^statistically significant change over the GRADIENT group at same time point.

