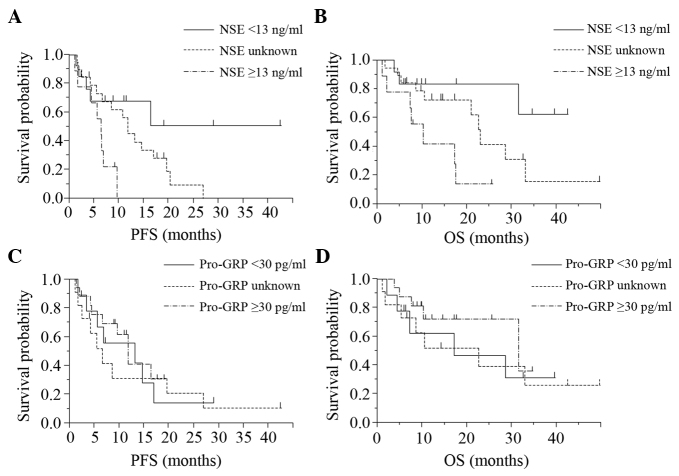
Figure 2.
Kaplan-Meier curve for each patient group divided according to the tumor marker level. Patients with (A) higher NSE levels had a shorter PFS than those with (B) lower PFS levels. No association was observed in the pro-GRP levels in (A) PFS and (B) OS. PFS, progression-free survival; OS, overall survival; NSE, neuron-specific enolase; pro-GRP, pro-gastrin-releasing peptide.

