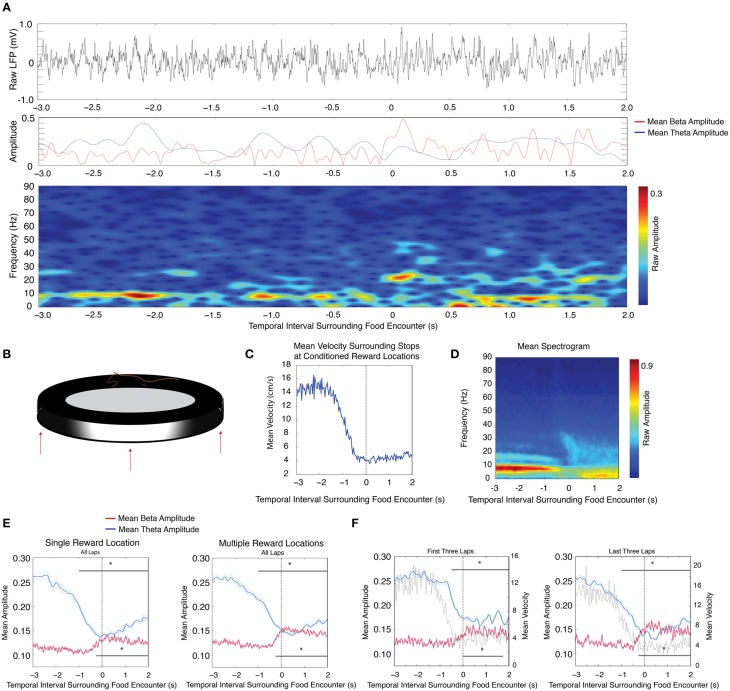
Figure 1.
Decreases in theta (4–12 Hz) amplitude and increases in beta (15–30 Hz) amplitude in response to conditioned reinforcement in a circular track paradigm. (A) Upper: Raw LFP trace as the rat approaches and stops at the reward location. The zero time point indicates a stop at the reward location. Middle: Instantaneous theta amplitude (blue) or beta amplitude (red) during the same time interval as the raw LFP trace. Lower: Gabor spectrogram during the same time interval as the raw LFP trace. (B) Cartoon schematic of the circular track apparatus with up to three example reward locations shown. (C) Mean velocity during intervals surrounding stops at conditioned reward locations. (D) Mean spectrogram across all sessions and all rats. Large amplitude 16 Hz oscillations prior to stops at conditioned reward locations likely reflect a theta harmonic. (E) Mean theta (blue) and mean beta (red) amplitude (mV) for recording sessions in which there was one (left) or multiple (right) conditioned reward locations. The zero point marks the rat's encounter with a conditioned reward location. The upper gray bar indicates 250 ms bins with significant decreases in theta amplitude and the lower gray bar indicates 250 ms bins with significant increases in beta amplitude. Error bars indicate standard error for theta (cyan) and beta (magenta) means. (F) Same as in (E), for the first three (left) and last three (right) laps of sessions in which there was more than one shift in reward location, with gray traces indicating the mean velocity; significant via Tukey's HSD, *p < 0.05.

