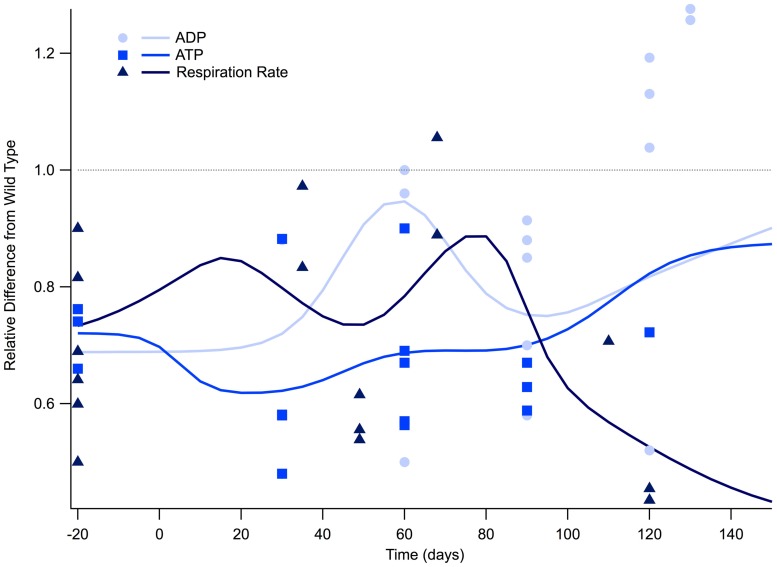
FIGURE 1.
Cellular respiration is depressed for the lifespan of the SOD1 G93A transgenic mouse model. The ratio of SOD1 G93A to wild type (SOD1 G93A/wild type) is plotted over time for experimental measures of adenosine triphosphate (ATP), adenosine diphosphate (ADP), and general respiration rate. Solid lines illustrate predicted trend lines. For visualization purposes, in vitro data is plotted at -20 days and in vivo time points are plotted at their corresponding post-natal day of assessment, 0–150 days. A gray dotted line is provided to show the expected wild type or homeostatic value. Trend lines are generated based on a Gaussian average of the normalized data points.

