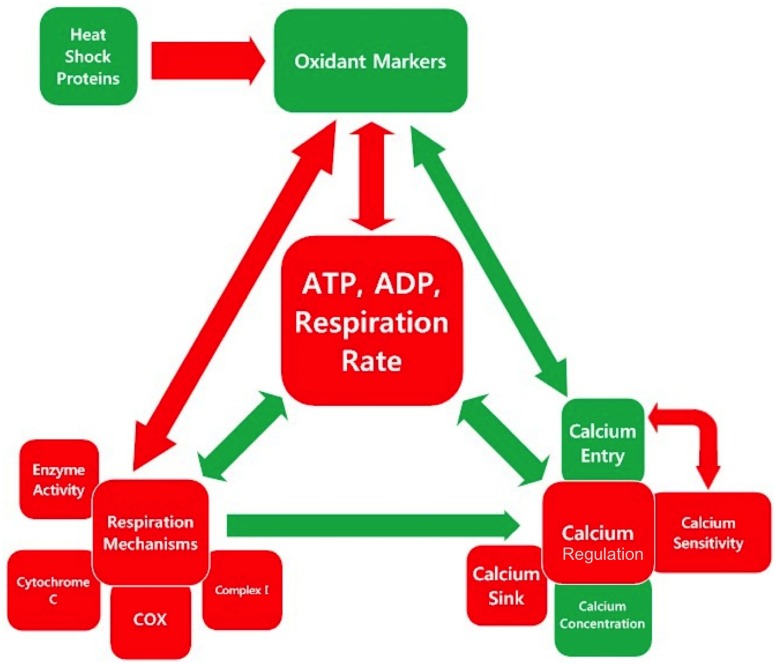
FIGURE 3.
Inter-relationships in the mitochondrial mechanism-oxidative regulation-calcium regulation triad center around cellular respiration. Each square is colored based on whether the assessed category is, on average, higher (green), or lower (red) in SOD1 G93A mice compared to wild type as determined by the overall trend line directionality from 0 to 150 days. The color of the arrow indicates the sign of the relationship, and the size indicates the relative magnitude.

