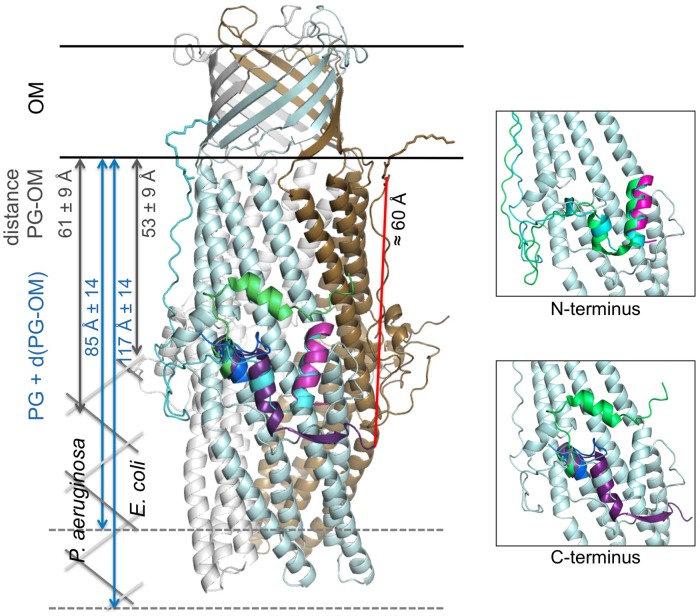
FIGURE 5.
Cartoon representation of the C2 OprM structure with the superposition of the N- and C-terminal regions of OprM, TolC and CmeC. The OprM trimer is shown in light blue, gray, and brown. The N-terminal region of OprM is shown in cyan, and its C-terminus is dark blue. The N- and C-termini of TolC are magenta and violet, respectively. Only the C-terminus of CmeC is presented (green) as the N-terminus is similar to that of OprM. The distance between the C-terminal residue present in the TolC structure and the closest N-terminal cysteine from a monomer in the OprM trimer is indicated (red). For comparison, a schematic drawing of the peptidoglycan (PG) has been added at scale for both Pseudomonas aeruginosa and Escherichia coli (dimension data are from Matias et al., 2003). Two close-up views of the buoy region with only one OprM monomer are presented for clarity. They correspond to the highlighting of the superposition of the N- and C-termini, respectively.

