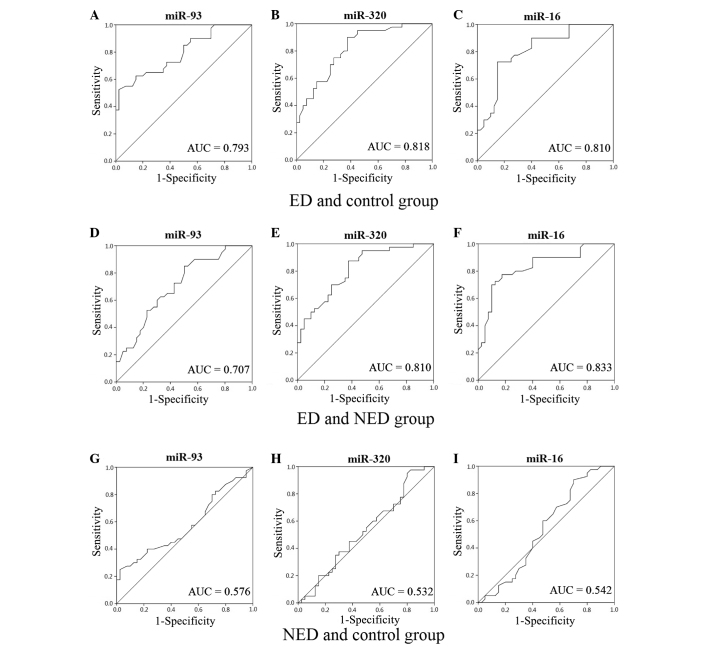
Figure 1.
Receiver operating characteristic (ROC) curves and the calculated AUC values for miR-93, miR-320 and miR-16. Representative ROC curves for the three miRNAs when comparing the (A–C) ED and control groups, (D–F) ED and NED groups, and (G–I) NED and control groups. miR, microRNA; ED, erectile dysfunction; NED, diabetes without erectile dysfunction; AUC, area under the curve.

