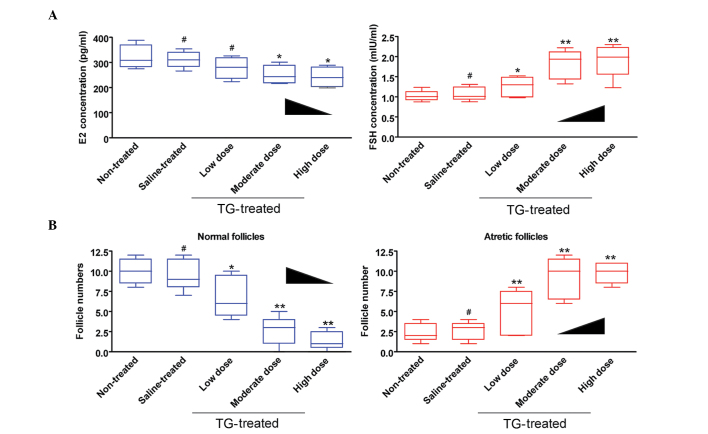
Figure 2.
Plasma E2 and FSH levels and follicle count. (A) Plasma E2 and FSH levels were determined by ELISA in each group following treatment with different concentrations of TGs, saline or no treatment. **P<0.01, *P<0.05 and #P>0.05 vs. non-treated; n=6. (B) Follicle count revealed that there were significantly more atretic follicles in the ovaries of the POF rats following treatment with different concentrations of TGs compared with the non-treated rats. There were also fewer normal follicles in the ovaries of the POF rats following treatment with different concentrations of TGs compared with the non-treated rats. **P<0.01, *P<0.05 and #P>0.05 vs. non-treated; n=6. TG, Tripterygium glycoside; E2, estradiol; FSH, follicle-stimulating hormone.

