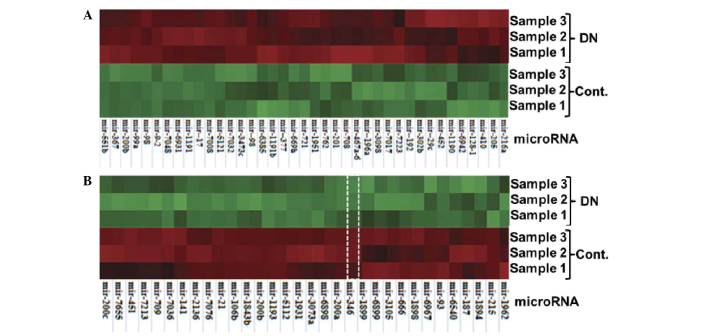
Figure 3.
Differentially expressed miRNAs in the renal tissue of DN mice. Isolated miRNAs from the renal tissues of db/m control and db/db DN mice were labeled with Cy3 (green) and Cy5 (red), respectively, prior to hybridization with a microRNA array. The color change was determined by the ratio of Cy3/Cy5. (A) Thirty-nine upregulated miRNAs; (B) 32 downregulated miRNAs (miR-346 is highlighted). The array information was obtained from Sanger miRBase Release 18.0 (http://www.mirbase.org). miRNA, microRNA; miR-346, microRNA-346; DN, diabetic nephropathy; Cont., control.

