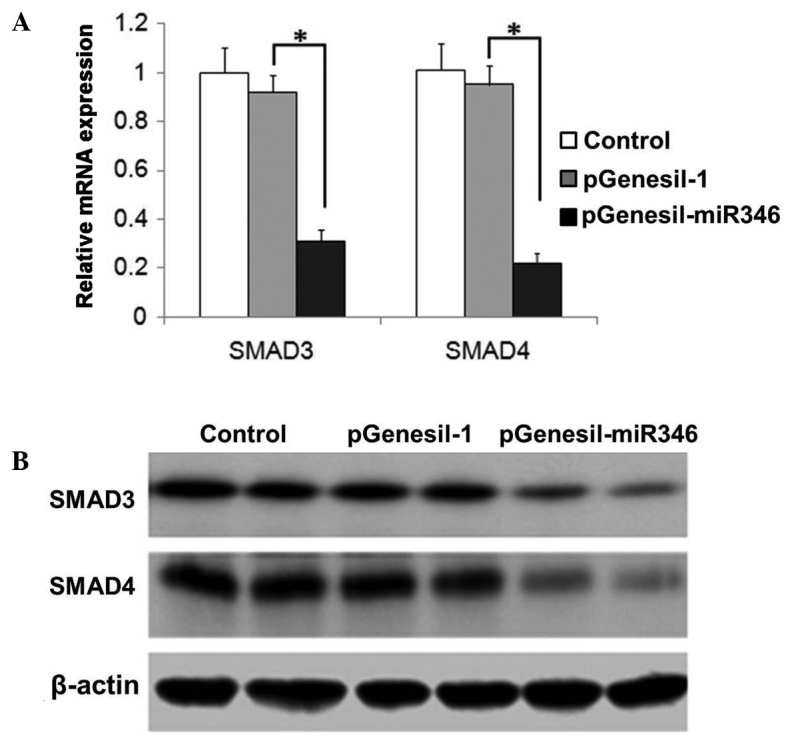
Figure 5.

Demonstration of SMAD3/4 expression in renal tissues. (A) mRNA expression determined through reverse transcription-quantitative polymerase chain reaction analysis; (B) protein expression assessed by immunoblotting analysis. *P<0.05.

Demonstration of SMAD3/4 expression in renal tissues. (A) mRNA expression determined through reverse transcription-quantitative polymerase chain reaction analysis; (B) protein expression assessed by immunoblotting analysis. *P<0.05.