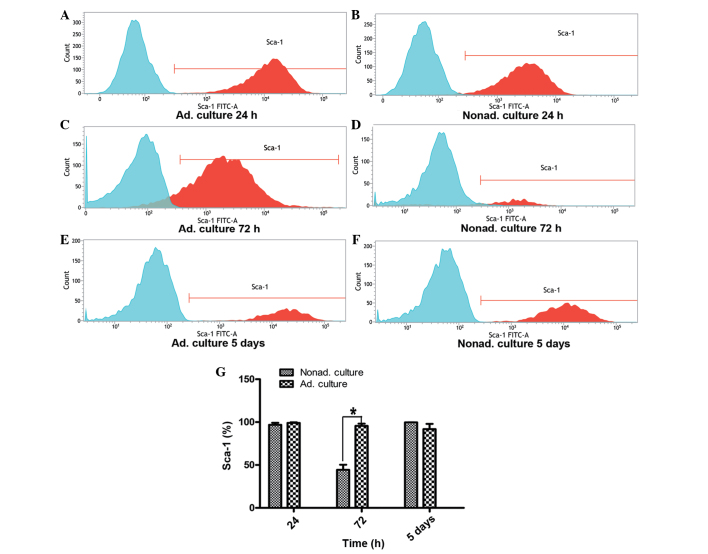
Figure 3.
Flow cytometry analysis of the expression of the Sca-1 surface marker. (A, C and E) Graphs represent Sca-1 expression on the adherent cultured cells at 24 h, 72 h and 5 days, respectively. (B, D and F) Graphs represent Sca-1 expression on the nonadherent cultured cells at 24 h, 72 h and 5 days, respectively. Expression of the Sca-1 surface marker was analyzed by fluorescence-activated cell sorting, and the expression levels were compared between the adherent and nonadherent cultured cells. Three independent experiments were performed with the cells between passages 9 and 11, which all showed similar Sca-1 expression. (G) Statistical histogram shows the differences in Sca-1 expression levels at 24 h (P>0.05), 72 h (*P<0.05) and 5 days (P>0.05) between the nonadherent and adherent cultured cells. FITC, fluorescein isothiocyanate; Ad, adherent; Nonad; nonadherent; Sca, stem cell antigen.

