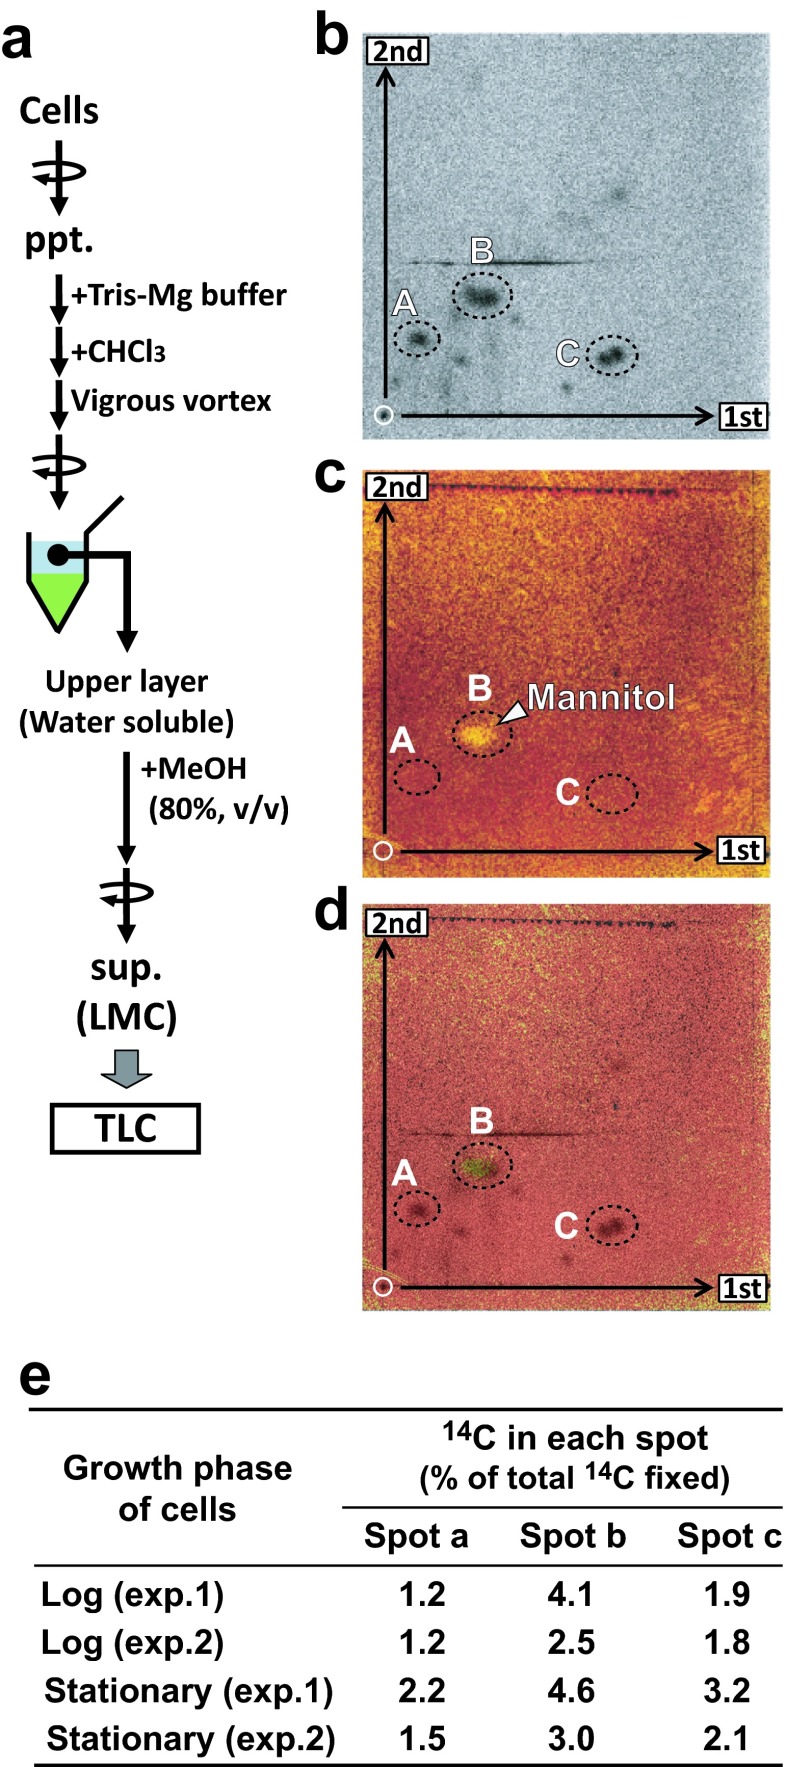
Fig. 4.
Two-dimensional TLC analysis of 14C-LMC produced by the coccolithophorid E. huxleyi NIES 837 under continuous illumination for 24 h. a Fractionation protocol for the preparation of LMC for TLC analysis. b Autoradiogram. c Mannitol spot (shown by arrow) visualized by KMnO4 reagent. d A merged image of the autoradiogram (b) and chemical staining of mannitol (c). The TLC images presented here are representative of two independent experiments using LP cells. e Quantification of 14C-mannitol (expressed as % of total 14C fixation). Results of two independent experiments (exp. 1 and 2) are shown

