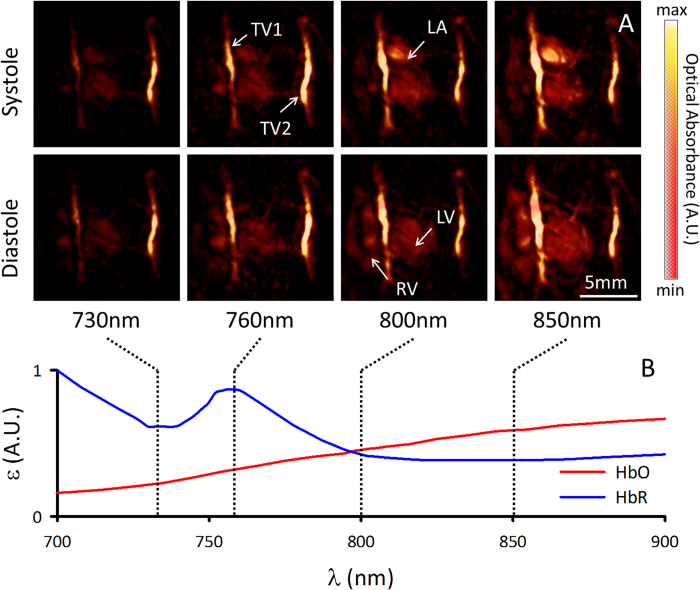
Figure 3. Functional information derived from multispectral volumetric cardiac images.
Images of the heart at systole and diastole are shown in panel A for each of the 730, 760, 800, and 850 nm acquisition wavelengths. The images are represented as maximum intensity projections along the depth axis, and intensities were normalized to the energy of the laser for each wavelength. The difference in the absorption profile of oxygenated and deoxygenated blood are respectively indicated by red (HbO, oxidized hemoglobin) and blue (HbR, reduced hemoglobin) lines in panel B. The wavelengths selected for experimentation are indicated by vertical dashed lines, and allowed for the distinction of relative oxygenation levels in the heart. Prominent anatomical features seen in Fig. 1c (right ventricle (RV), left ventricle (LV), left atrium (LA), thoracic vessels TV1 and TV2) are also indicated in panel A.

