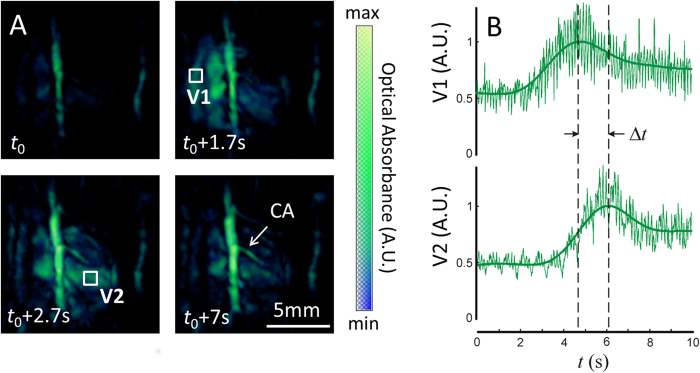
Figure 4. Tracking cardiac flow dynamics using blood-pool contrast agent, indocyanine green (ICG).
Snapshots from the time series of images taken during the ICG injection experiment are shown as maximum intensity projections in panel A. Time points are chosen illustrating a baseline image at 800 nm (t0), the entry of the ICG bolus into the RV (t0 + 1.7s), later entry of ICG into the LV (t0 + 2.7s), and late phase, near homogenous distribution of ICG in the bloodstream (t0 + 7s). Volumes of interest are depicted on the maximum intensity projections corresponding to the right ventricle (V1) and left ventricle (V2), respectively. The intensities of the absorption signals at 800 nm for V1 and V2 are plotted in panel B. Peak values of the signal V1 and V2 represent the arrival times of ICG into the right and left ventricles, respectively. The difference in the time to peak values at V1 and V2 (Δt) can therefore be used as a quantitiative measure of pulmonary transit time.

