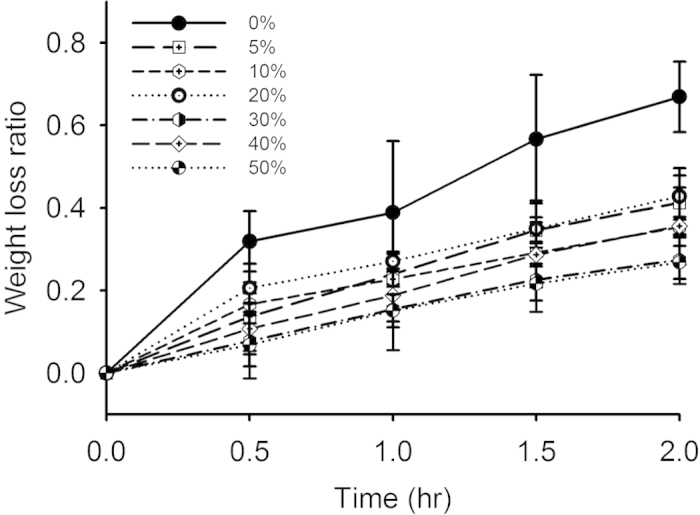
Figure 6. Weight loss ratios of thrombi with different hematocrits as a function of the lysis time.

The weight loss ratio was approximately proportional to the lysis time for each hematocrit. The largest ratio of weight loss was observed at a hematocrit of 0% (%: the volume percentage of RBCs in a thrombus).
