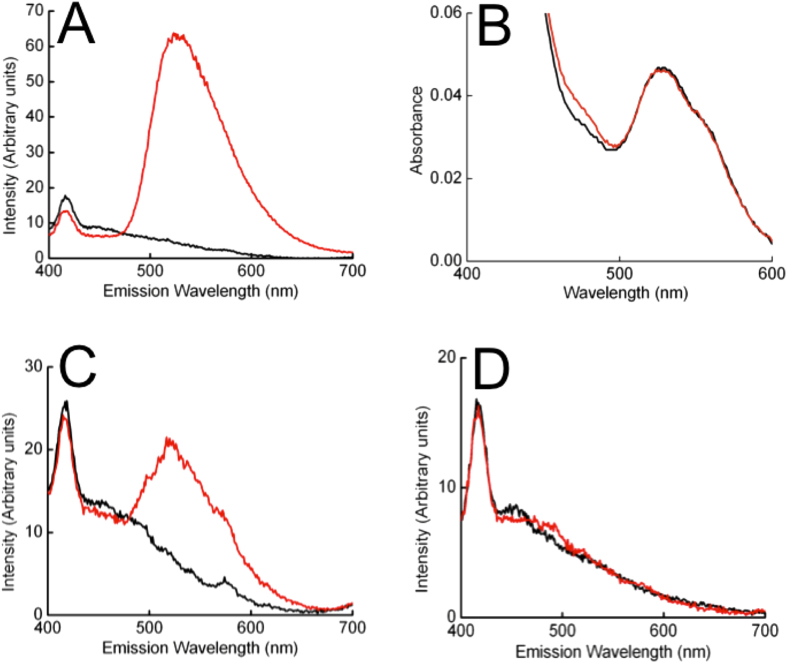
Figure 5. Fluorescence and UV-visible absorbance spectra of outer membrane multiheme cytochromes incubated with FMN and glutathione.
(A) Anaerobic fluorescence spectra of OmcA isolated from a solution containing 10 μM FMN in the presence (red line) and absence (black line) of 1 mM glutathione. (B) Absorbance spectra of 1 μM OmcA isolated from a solution containing FMN and glutathione (red line) overlaid on a spectrum of oxidised OmcA (black line) (C) Anaerobic fluorescence spectrum of MtrF isolated from a solution containing 10 μM FMN in the presence (red line) and absence (black line) of 1 mM glutathione. (D) Anaerobic fluorescence spectrum of UndA isolated from a solution containing 10 μM FMN in the presence (red line) and absence (black line) of 1 mM glutathione.

