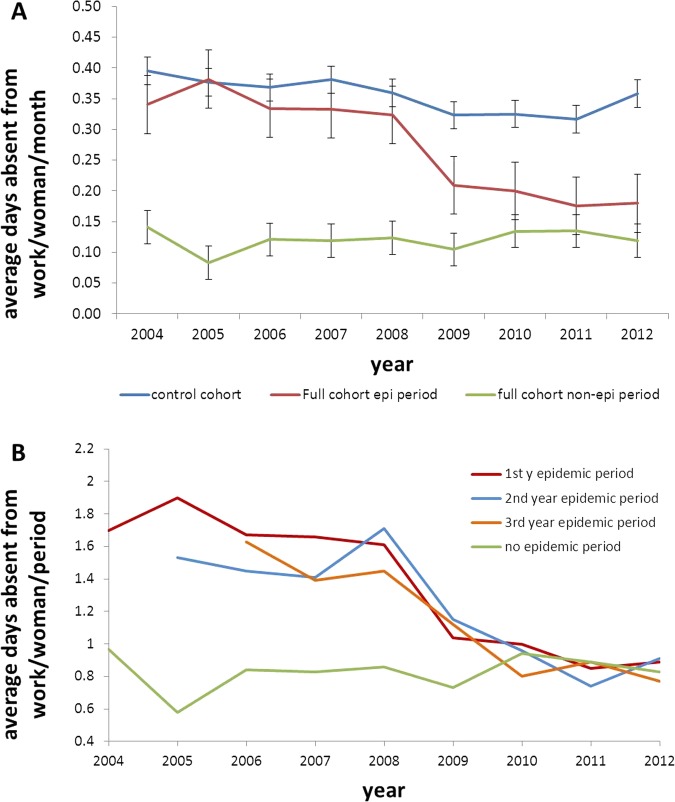
Figure 2.
(A) Average number of short work absences per woman per month for the control group (blue), the full cohort of mothers during the epidemic period (red), and during the non-epidemic period (green) and (B) Average number of short work absences per woman in the full cohort in the first (red), second (blue) and third (yellow) years postpartum during the epidemic period and the non-epidemic period (green).

