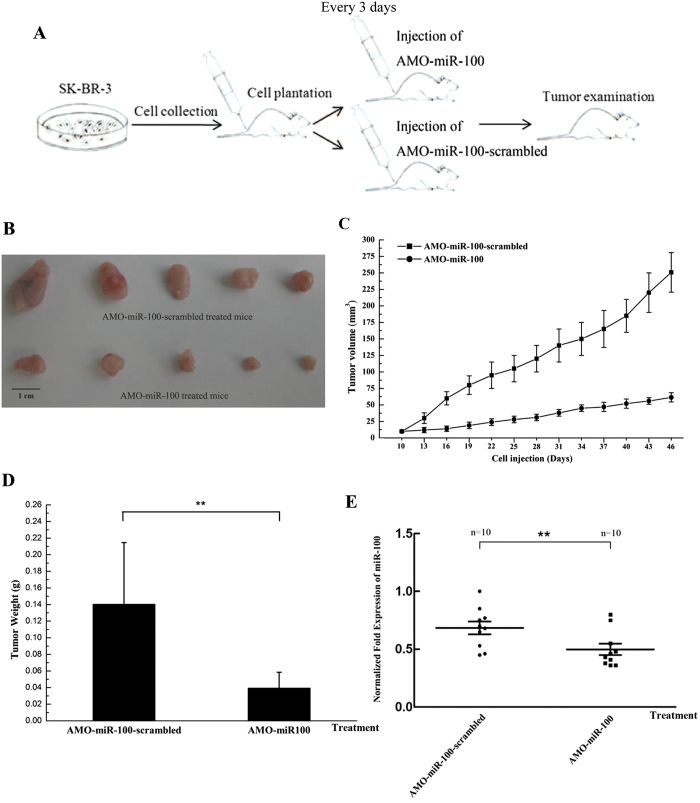
Figure 2. The effects of miR-100 on the tumourigenesis of breast cancer cells in vivo.
(A) A flow diagram of the in vivo experiments. (B) The effects of the inhibition of miR-100 expression on solid tumours in nude mice. SK-BR-3 cells were injected into nude mice and 10 d later AMO-miR-100-scrambled or AMO-miR-100 was subcutaneously and intravenously injected into mice. The tumour images were obtained 46 d after cell injection. The effect of miR-100 silencing on tumour volume (C) and weight (D). The mice were treated with AMOs and then the tumour volume and weight was examined 46 d after cell injection. The data were the means results from 10 mice. (E) The expression of miR-100 in tumour tissues. Solid tumours treated with AMOs were subjected to real-time PCR to evaluate the miR-100 expression level. The data represented the means ± standard deviations of triplicate assays. The statistically significant differences between different treatments were indicated with asterisks (**p < 0.01).

