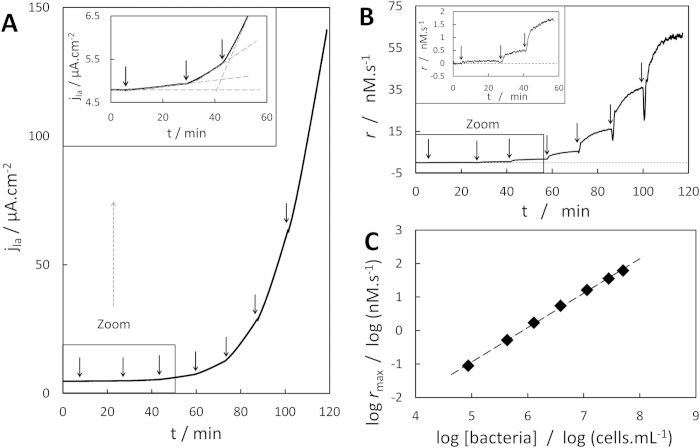
Figure 4. Impact of F. prausnitzii concentration on reaction rate.
(A) Chronoamperogram recorded at −0.25 V vs. Ag/AgCl, 2000 rpm, 150 μM RF, arrows represent additions of F. prausnitzii from a concentrated suspension (7.9 × 10⁸ cells.mL−1); inset: zoom on impact of lowest bacterial concentrations. (B) Corresponding evolution of RF consumption rate; inset: zoom on impact of lowest bacterial concentrations. (C) Evolution of the maximal RF consumption rate with bacterial density.

