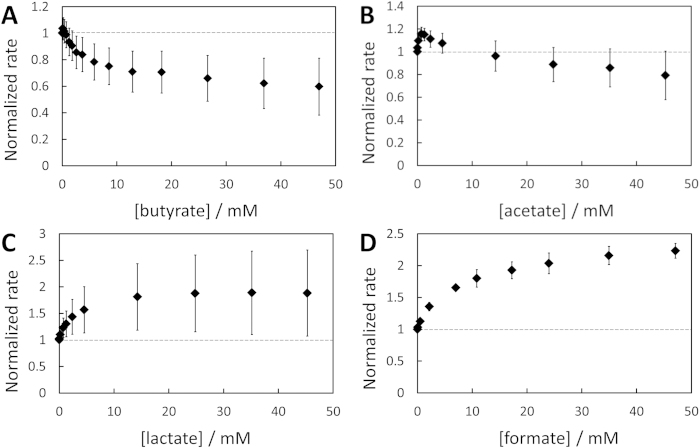
Figure 6. Impact of carboxylate products on RF reduction rate.
(A) Butyrate (n = 5), (B) acetate (n = 3), (C) lactate (n = 4), (D) formate (n = 3). Normalization is made with respect to the initial, stable rate of RF reduction rate before any carboxylate addition. Error bars are two-times the standard deviation. An example of chronoamperogram showing the evolution of the RF reduction rate with lactate addition is presented in Supplementary Fig. S12.

