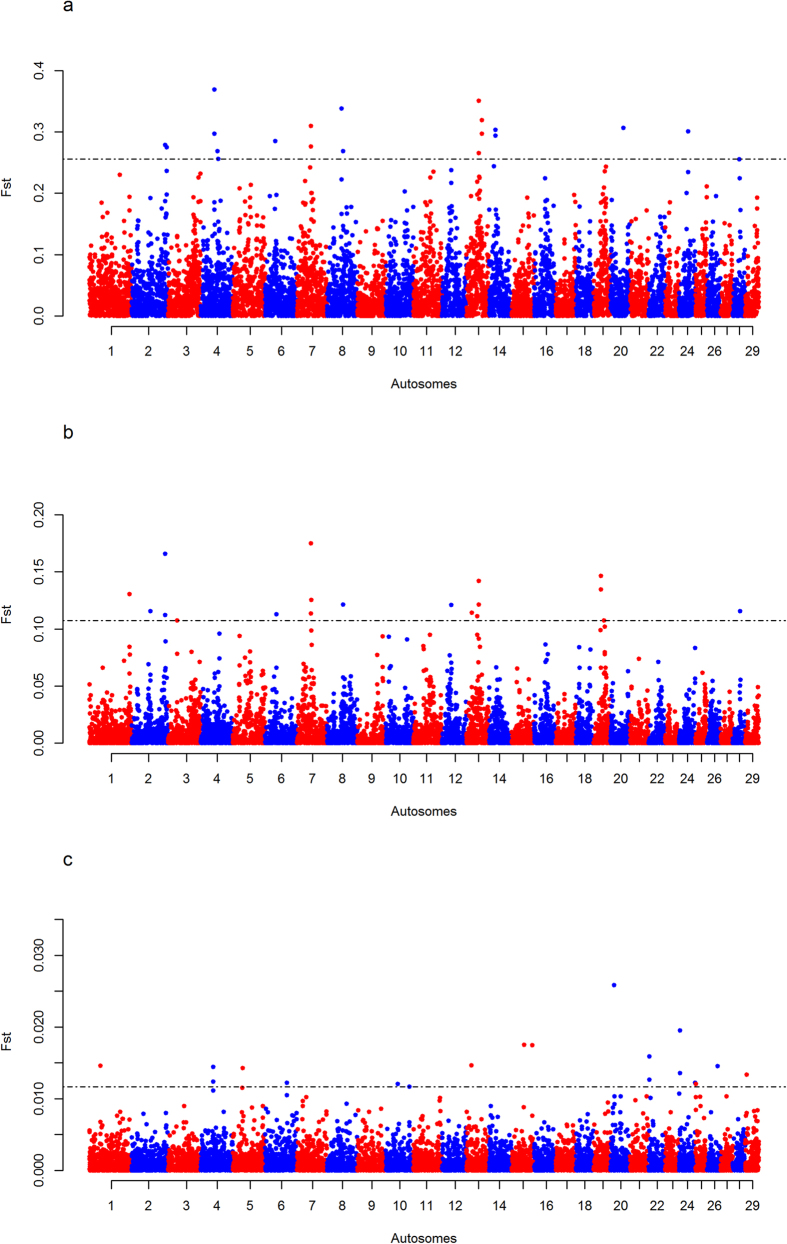
Figure 1. Manhattan plots of the pairwise genome-wide autosomal FST analyses.
(A) EASZ with European taurine (Holstein-Friesian, Jersey), (B) EASZ with African taurine (N’Dama), and (C) EASZ with Asian zebu (Nellore). The significant thresholds (dashed line) are set at the top 0.2% of the FST distribution.

