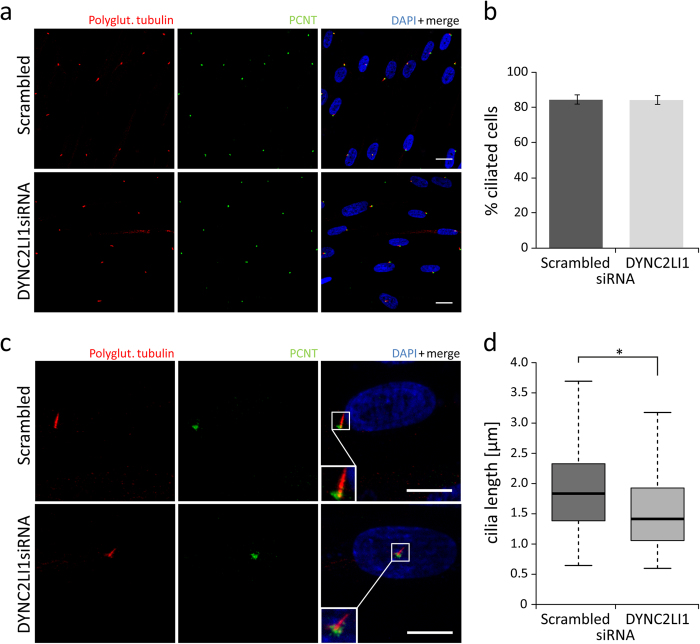
Figure 3. Number of primary cilia and cilia length in DYNC2LI1 depleted cells compared to scrambled control.
Immunofluorescence staining of 5 days starved fibroblasts (scrambled control vs. DYNC2LI1siRNA) with antibodies against polyglutamylated tubulin (primary cilium, red), PCNT (green) and DAPI (DNA, blue in merge). (a,b) No significant differences in the number of cilium presenting cells were observed, 85% of control cells and 84% of DYNC2LI1 depleted cells showed primary cilium formation (p = 0.927 [χ2-test], white scale bars 20 μm). (c,d) The median cilia length was 1.83 μm in scrambled control cells, whereas cilia in knockdown cells were significantly shorter with median of 1.42 μm (p = 1.205 × 10⁻⁶ [Mann-Whitney-U test]). Magnifications are shown in white boxes, white scale bars 10 μm).

