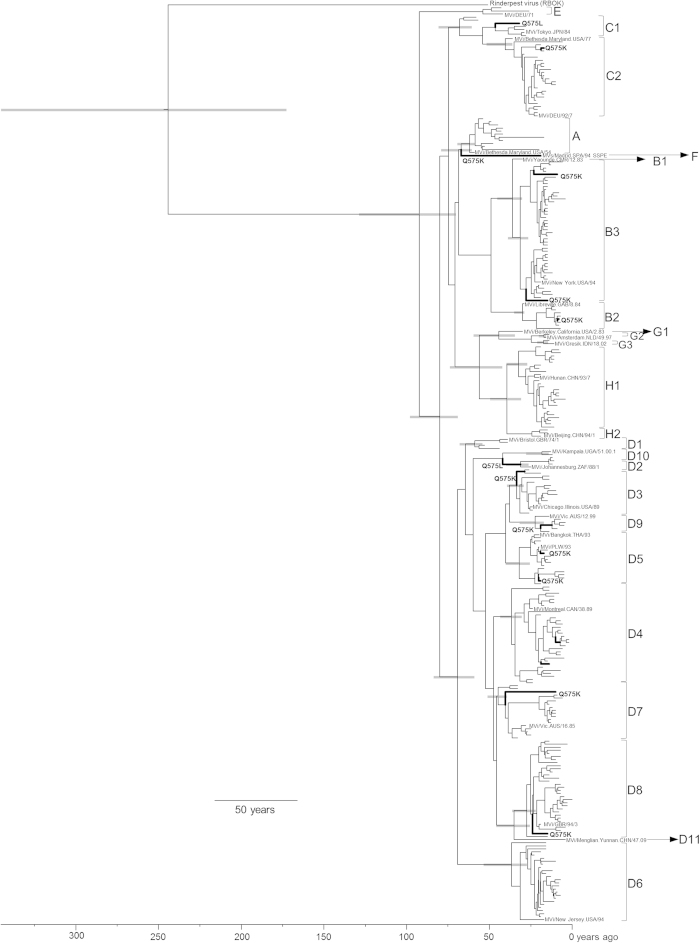
Figure 1. Phylogenetic tree of the haemagglutinin (H) gene constructed by the Bayesian Markov chain Monte Carlo method.
The Markov chain Monte Carlo tree was based on the full nucleotide sequence of the H gene (1854 nt) visualised in FigTree. Grey bars indicate 95% highest posterior density for the estimated year. The tree was estimated using an uncorrelated exponential relaxed clock model under an exponential growth model. The scale bar represents the unit of time (year). The reference strains of each genotype are shown in the tree. Common positively selected sites (aa 575) are indicated by a bold line.

