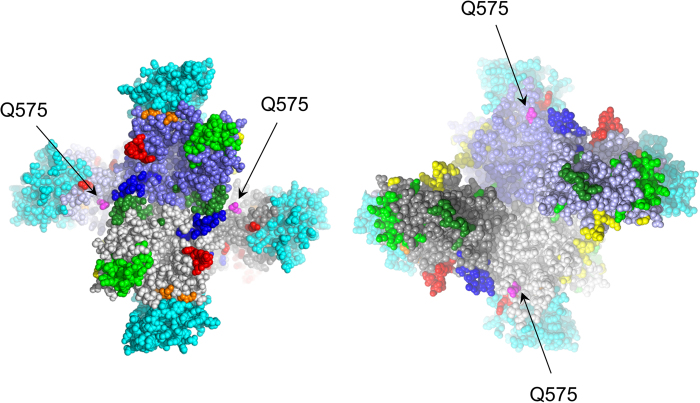
Figure 3. Mapping of the positive selection sites on the H protein structure.
An H protein homotetramer determined by Hashiguchi et al.11 (PDB3ALZ) is shown. (Left) Top view; (Right) bottom view. The individual H proteins in the tetramer are shown in grey, light grey, purple, and light purple, and SLAMs are shown in cyan. Amino acid residues known to constitute a portion of an epitope are shown in blue, green, light green, yellow, orange, and red. The glutamine residues at position 575 (Q575) are shown in magenta.

