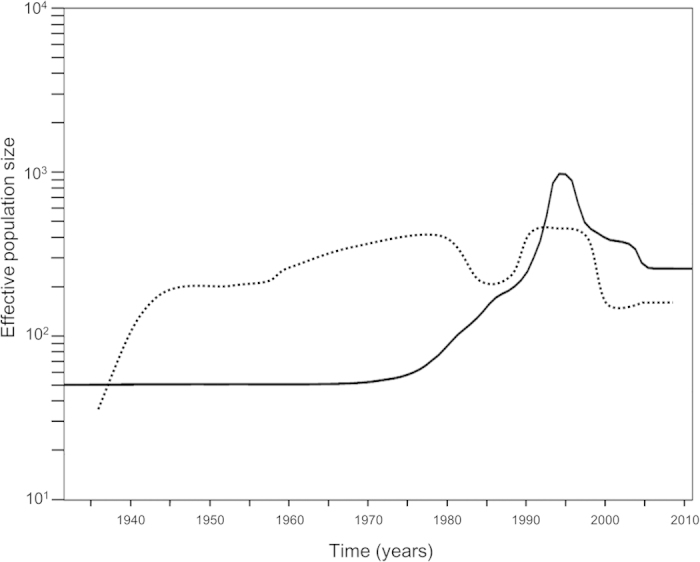
Figure 4. Bayesian skyline plot analysis of the measles virus H gene.

The Y-axis shows the effective population size and the X-axis shows generation time (year). Mean effective population size of major genotypes including B3, D4, D8, D9, and H1 are indicated by a solid line. Mean effective population size of minor genotypes such as B1, C1, E, and F are indicated by a dotted line.
